Machine Learning · Real Estate · Indonesia

Predicting
Property Prices

Uncovering the factors that drive house and apartment prices in Indonesia — using XGBoost and SHAP analysis on ~48,000 active property listings.

Web Scraping XGBoost SHAP Analysis Cross Validation Python
48K+
Property Listings Collected
8.98%
MAPE Score
0.72
R² Score

What Actually Determines
a Property's Price?

Property prices are shaped by dozens of interacting factors — from geographic location and building size to neighborhood amenities. This project was born from a simple curiosity: which factors most strongly drive house and apartment prices across Indonesia?

The Problem

Indonesia's property market is enormously diverse — prices can vary dramatically between cities, even between districts within the same city. Prospective buyers and investors often struggle to judge whether a listed price is actually fair.

The Approach

By gathering real-world data from active property listing platforms, training an XGBoost regression model, and applying SHAP (SHapley Additive exPlanations) to interpret it — we can transparently surface which features matter most and by how much.

Scraping ~48,000 Active
Property Listings

Data was gathered from multiple property listing platforms while fully adhering to each platform's terms and conditions. The collection process followed a structured four-step pipeline.

01

Web Scraping

Collected listings for houses and apartments actively offered for sale across multiple platforms, respecting each site's terms of service throughout.

02

Data Cleaning

Removed duplicate entries and standardized categorical formats and aligned numerical scales to ensure data consistency.

03

Feature Engineering

Extracted structured features from raw listing text, created binary indicator variables for amenities (CCTV, garden, toll access, etc.), applied categorical encoding, and applied a log-transformation to the target price variable.

04

Final Dataset

The cleaned dataset contains ~48,000 rows and 34 features spanning physical dimensions, location, amenities, and legal specifications of each property.

34 Features Analyzed

Each property listing is represented by a combination of numerical, categorical, and binary amenity features.

Numerical
Categorical
Binary (0/1)
Price (IDR)
Land Area (m²)
Building Area (m²)
Number of Bedrooms
Number of Bathrooms
Floor Level
Carport Capacity
Electricity (Watt)
Year Built
City / Regency
Property Category
Market (Primary / Sec.)
Certificate Type
Facing Direction
Furnishing Status
Condition
Water Source
Government Subsidy
AC
Kitchen Set
Water Heater
CCTV
Swimming Pool
Garden
24h Security
One Gate System
Jogging Track
Place of Worship
Near School
Near University
Near Bus Terminal
Toll Road Access
Hospital Access
Mall Access

XGBoost Regression

XGBoost (eXtreme Gradient Boosting) was selected for its ability to handle mixed tabular data with both numerical and categorical features, its robustness to outliers, and its native compatibility with SHAP for model interpretability.

Why XGBoost?

  • Handles mixed numerical & categorical features natively
  • Robust to missing values and price outliers
  • Built-in L1/L2 regularization prevents overfitting
  • First-class SHAP integration for interpretability
  • Efficient training on tens of thousands of records

Training Pipeline

  • Target variable: log-transformed price (IDR)
  • Ordinal & one-hot encoding for categorical features
  • Validation using K-Fold Cross Validation
  • Metrics: MAPE and R² Score

Cross Validation Results

Evaluation was performed using K-Fold Cross Validation to obtain robust performance estimates and prevent data leakage between training and testing splits.

Mean Absolute Percentage Error
8.98%
On average, predictions deviate by only ~8.98% from the actual price
R² Score
0.7206
The model explains 72% of price variance across all listings

Interpreting the Results

A MAPE of 8.98% means the model predicts property prices with an average deviation of under 9% — a highly competitive result given the extreme price variation across Indonesian cities and property types. An R² Score of 0.7206 indicates that 72.06% of price variability is explained by the 34 available features. The remaining 28% is likely attributable to factors not captured in the data — micro-location nuances, negotiation dynamics, or seller-specific conditions that are difficult to quantify from a listing alone.

The Factors That Drive
Property Prices

SHAP (SHapley Additive exPlanations) was applied to the trained XGBoost model to produce global feature impact insights. Each dot on the beeswarm plot represents one property — red indicates a high feature value, blue a low one, and horizontal position shows the direction and magnitude of its impact on the predicted price.

  • 1
    City / Regency

    Location is the strongest driver, since it shows a wide SHAP distribution. This suggests the model has learned significant differences between locations, with some areas strongly increasing or decreasing the prediction.

  • 2
    Government Subsidy

    Subsidy status consistently pushes prices down — subsidized properties carry a strong negative SHAP signal, clearly delineating the affordable housing segment.

  • 3
    Building Area (m²)

    Larger building areas (shown in red) produce consistently positive SHAP values. The relationship is strong and monotonic across the entire dataset.

  • 4
    Number of Bathrooms

    Bathroom count serves as a strong proxy for property quality and luxury tier — more bathrooms reliably translate to higher predicted prices.

  • 5
    Land Area (m²)

    Larger land plots increase property value, particularly relevant in the landed house segment where plot size is a core pricing component.

  • 6
    Electricity Capacity (Watt)

    Higher electrical capacity is associated with higher predicted outcomes.

SHAP Beeswarm Plot — Global Feature Impact on Real Estate Price Prediction

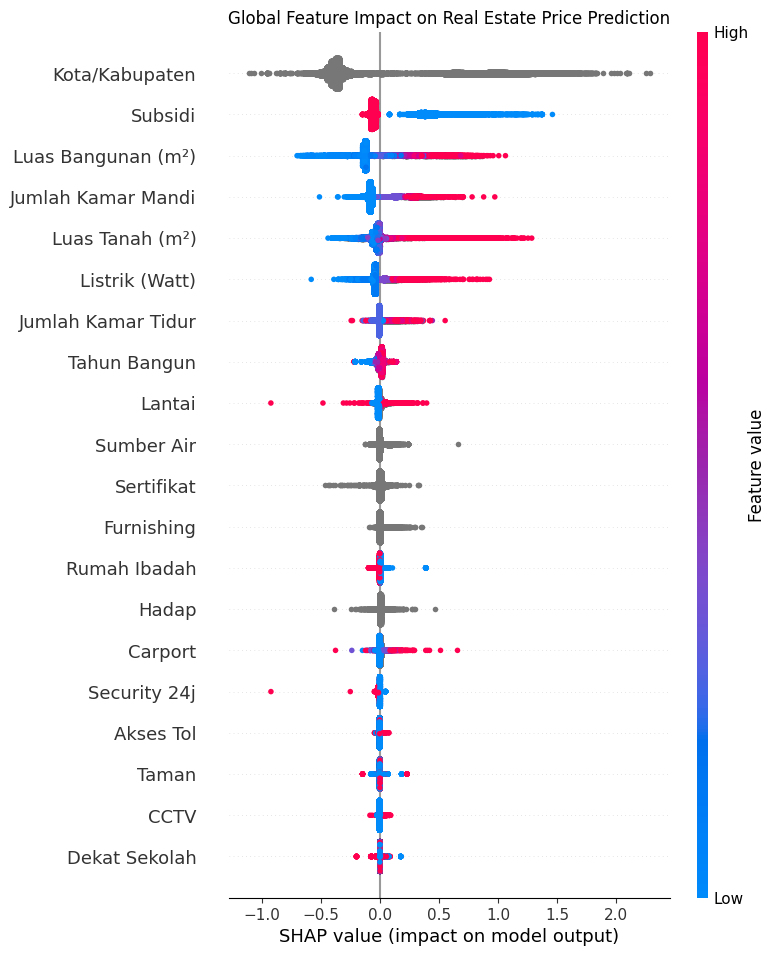
Global Feature Impact on Real Estate Price Prediction · SHAP Beeswarm Plot

Tools & Libraries

🐍
Python
Core language
🕷️
BeautifulSoup / Playwright
Web scraping
🐼
Pandas & NumPy
Data processing
XGBoost
ML model
🔬
Scikit-learn
CV & preprocessing
🔎
SHAP
Model interpretability
📊
Matplotlib / Seaborn
Visualization
📓
Jupyter Notebook
Exploration & analysis